Collibra Dashboards Redesign
Product Design, UX Research, Beta

What is Collibra?
Collibra is a white-labeled data management website that is sold to other companies like Starbucks, American Express, etc. Data loaded inside Collibra can be updated, accessed, managed, and protected so companies can make informed business decisions.
There are three main types of users: Analysts access data for reports. Data Engineers put the data into Collibra. And Governance Mangers manage and control access.
I redesigned Collibra’s high-impact Dashboards for both consumers and editors.
Collibra customers create several dashboards tailor-made for different teams. When users enter Collibra, their favorite Dashboard is the first page they see. Dashboards summarize new content and launch users where they need to go. Since it’s a popular feature, improvements are a common request from customers. This case study captures multiple sprints of my work that happened quarterly over the course of a year.
Collibra's Dashboards are built on top of a third-party feature. This means we're constrained in the styling that we can apply to it. The UI and the styling itself had never been handled by a designer. Applying even the simplest best practices like Gestalt's Law of Proximity made significant differences to the overall product experience.
Collibra's Dashboards are built on top of a third-party feature. This means we're constrained in the styling that we can apply to it. The UI and the styling itself had never been handled by a designer. Applying even the simplest best practices like Gestalt's Law of Proximity made significant differences to the overall product experience.
4 Problems: Strange Page Layout, Old Design Style, Alpha-Order Logic, & Inconsistent Editor View
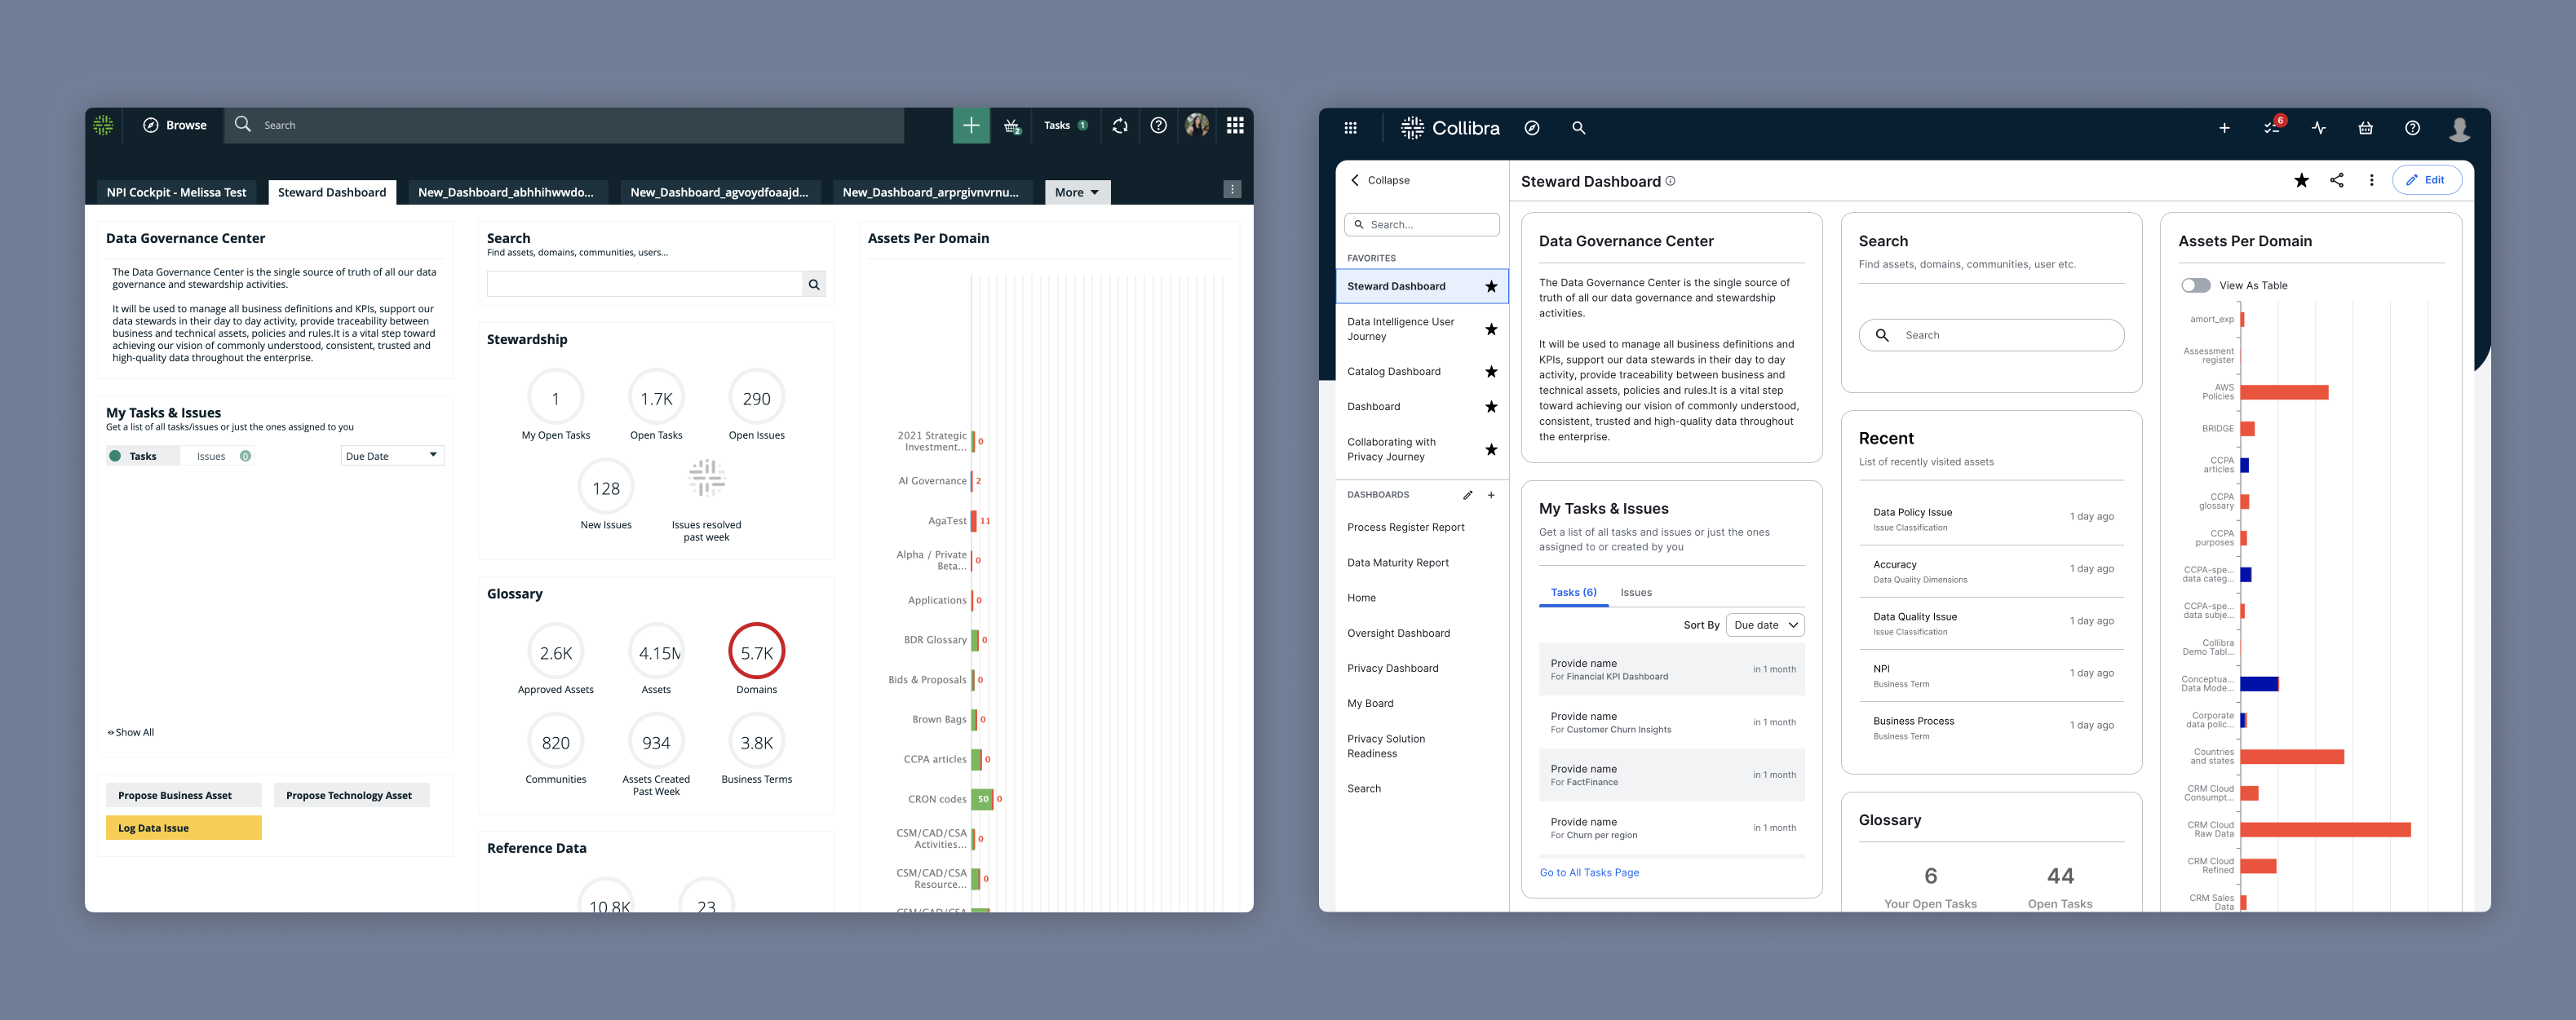
Solution 1: Improve Page Layout
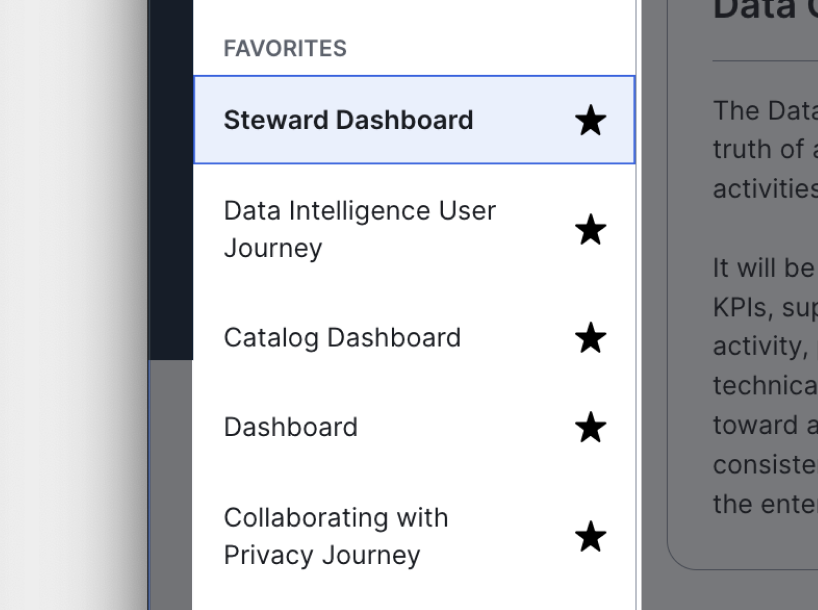
Users could only see their top five dashboards so I replaced the tabs navigation with a collapsible left side bar. This makes it easier for users to see all their dashboards at a glance and utilize new features to quickly search, favorite, and navigate between their dashboards. At the same time, the menu can collapse down to make more room for the main star...the widgets!
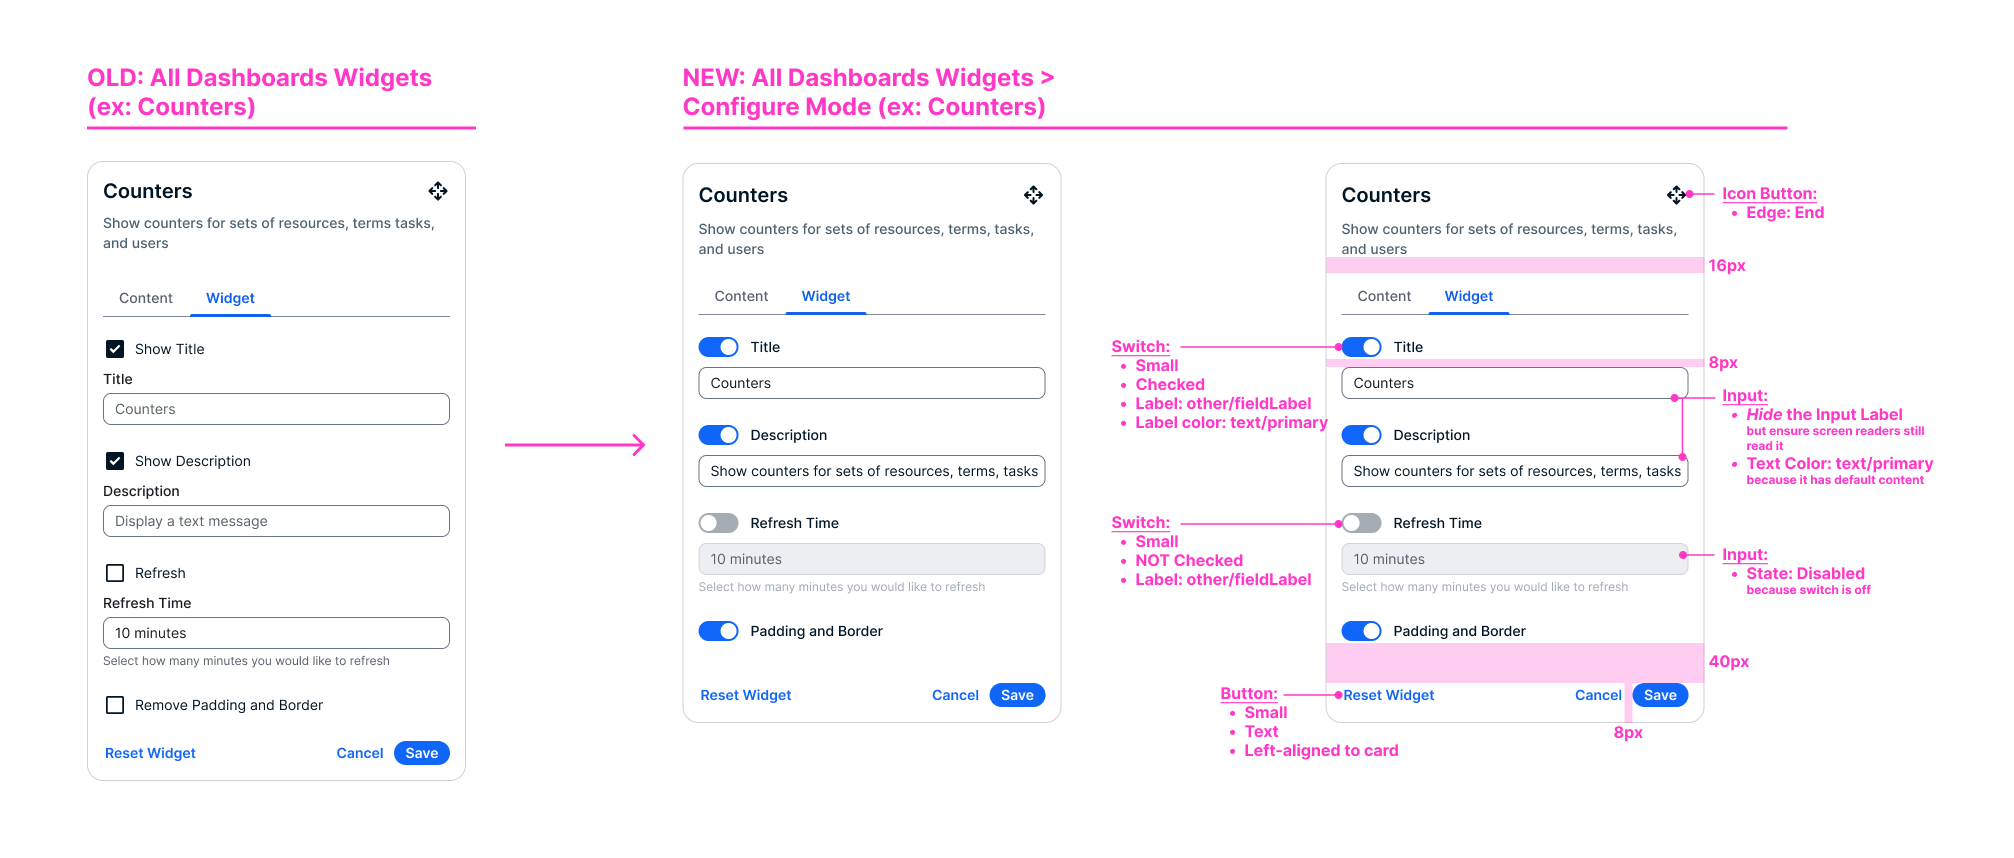
Solution 2: Modernize Visual Design
Collibra’s old UI looked straight out of the 2000’s. In May 2024, Collibra officially launched their new UI with a new design system. Aside from updating the colors, I rounded corners, added more padding and elevation, and standardized visual design patterns and page layouts.
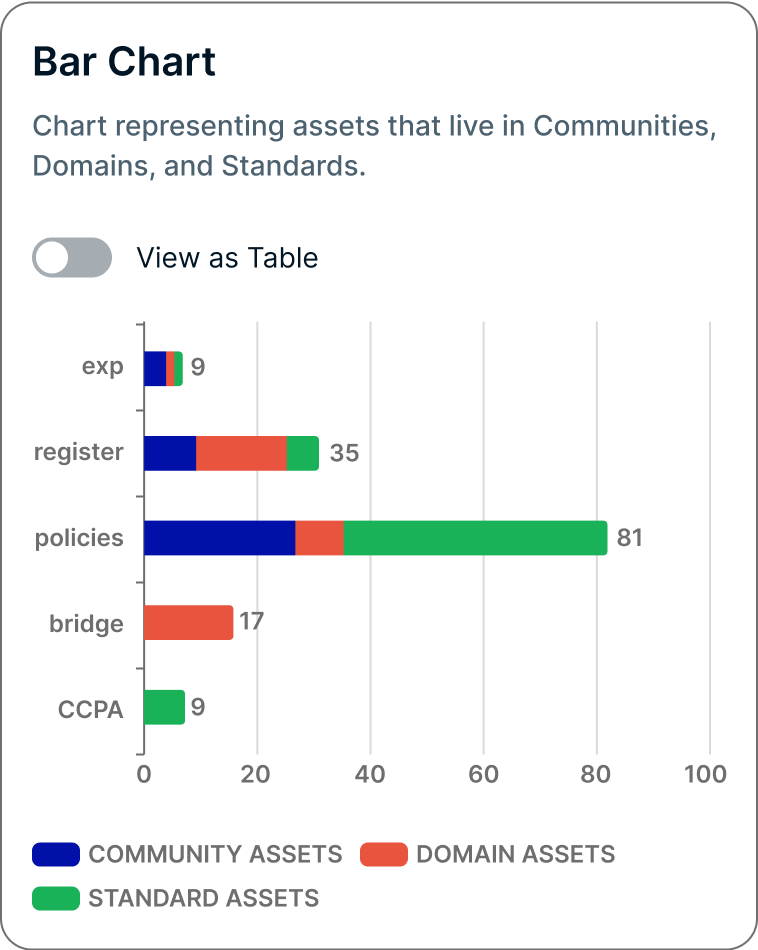
Brighter, Accessible Colors
Components and data visualization colors were updated to Collibra’s new brand identity and WCAG AA Accessibility requirements.
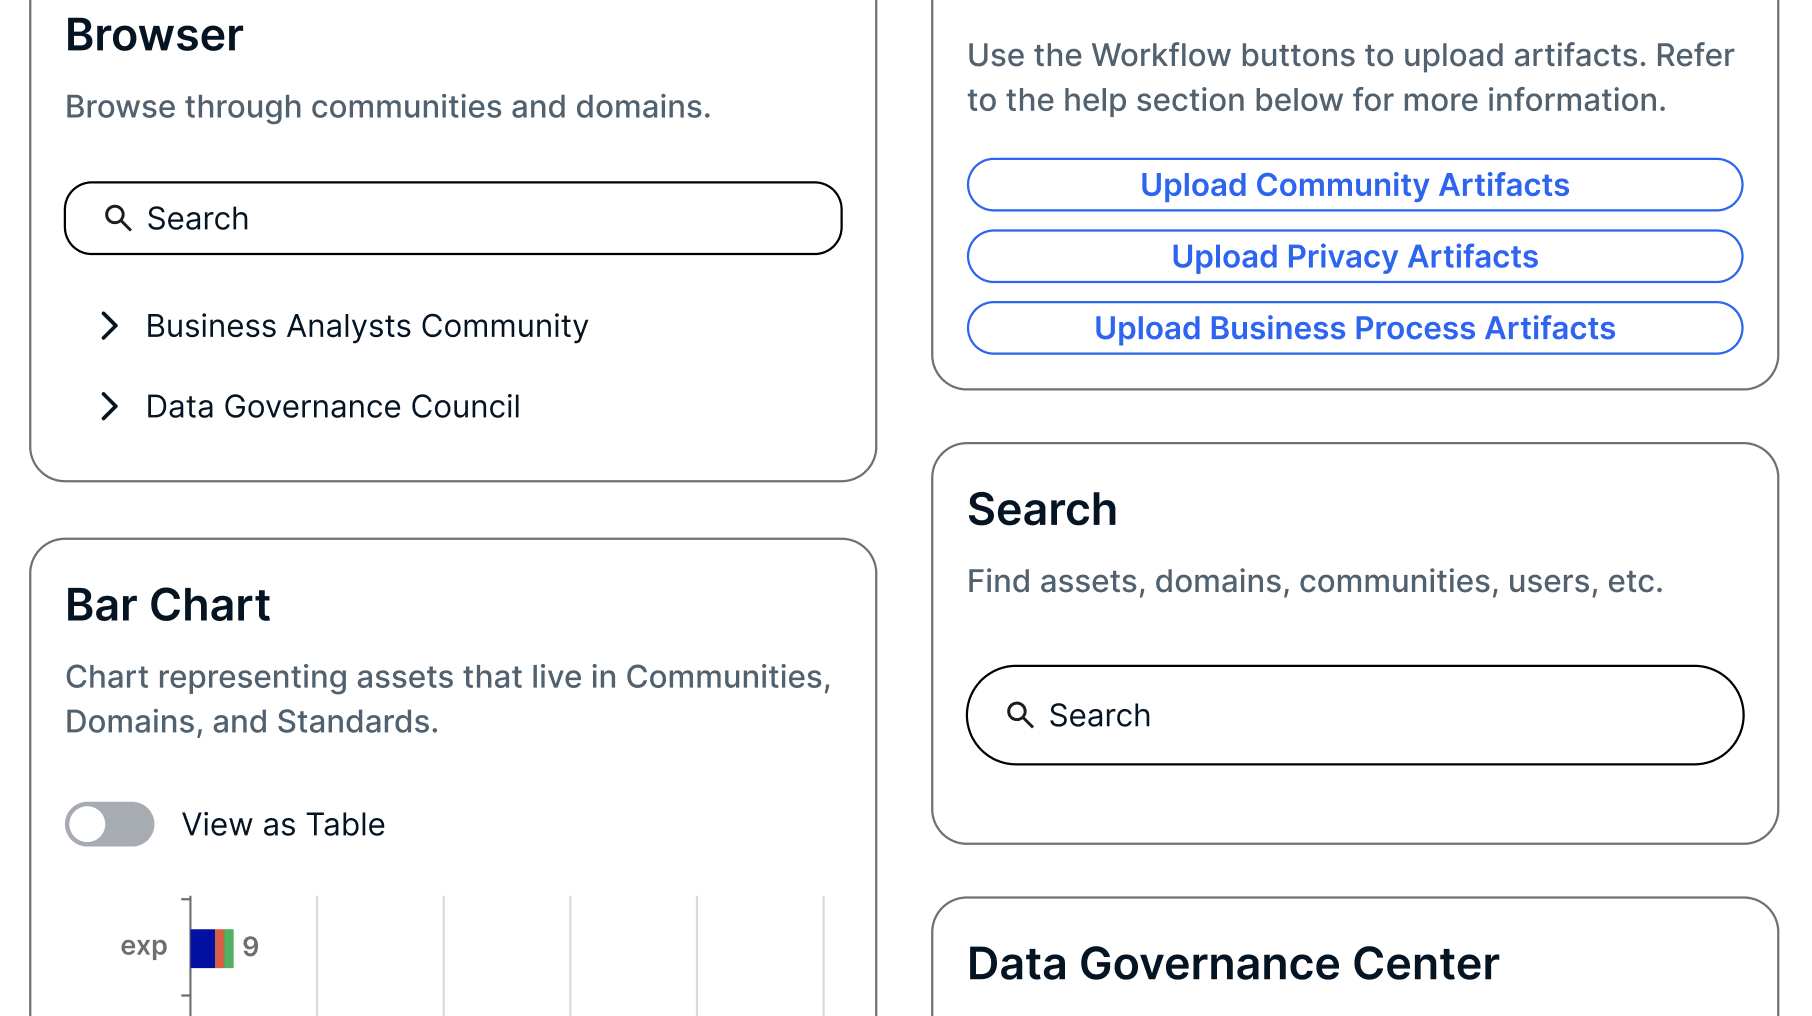
Corners & Padding
I rounded corners and increased padding to balance content density and white space.
6 Design System Patterns
Let's look at one example: “Stars vs Pins.” We integrated stars and pins into the dashboards which matches the UI elsewhere in Collibra.
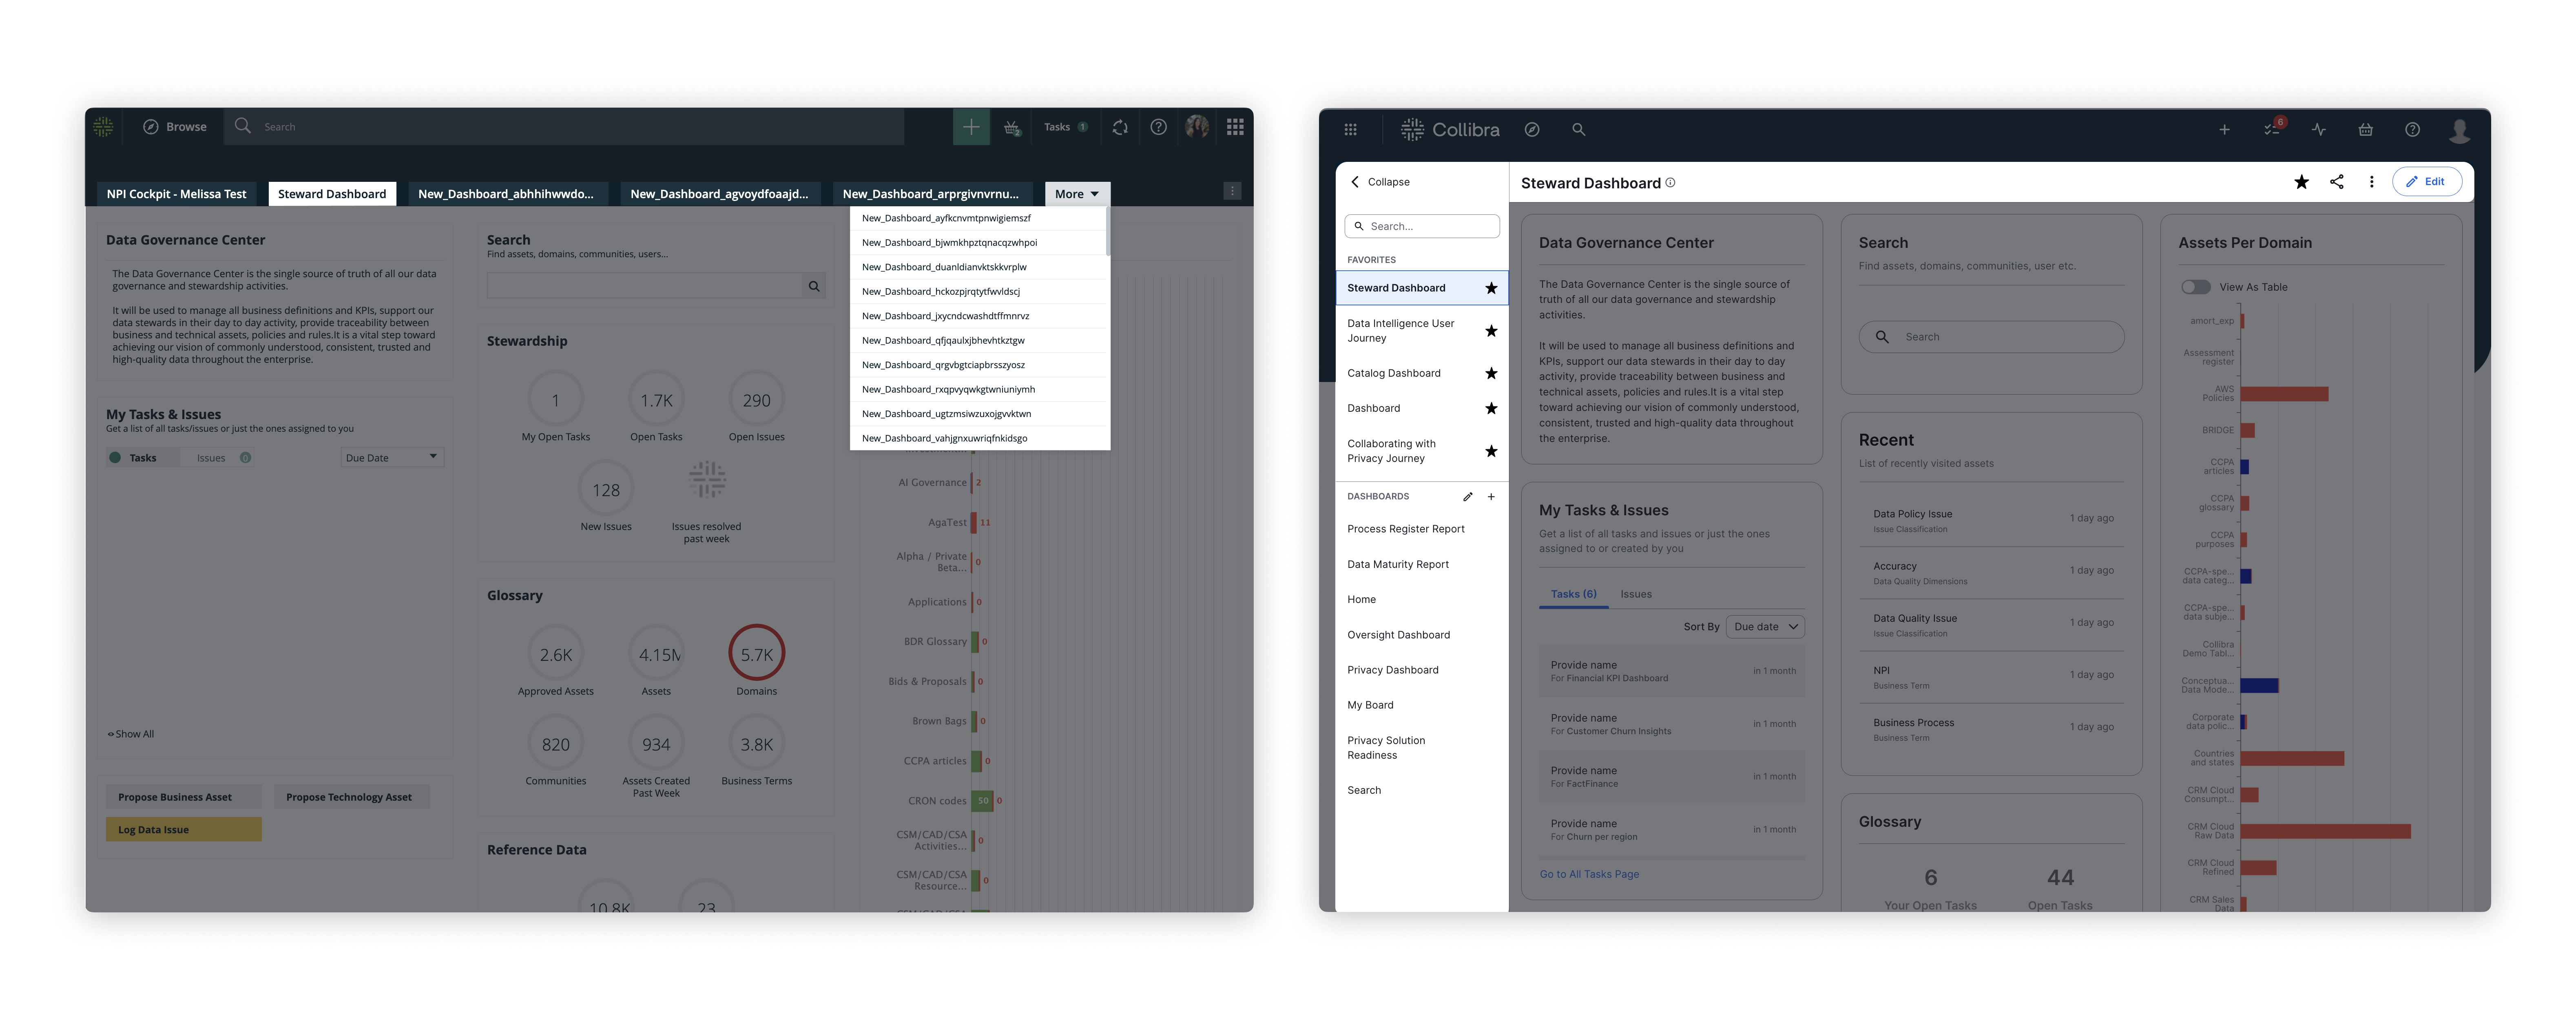
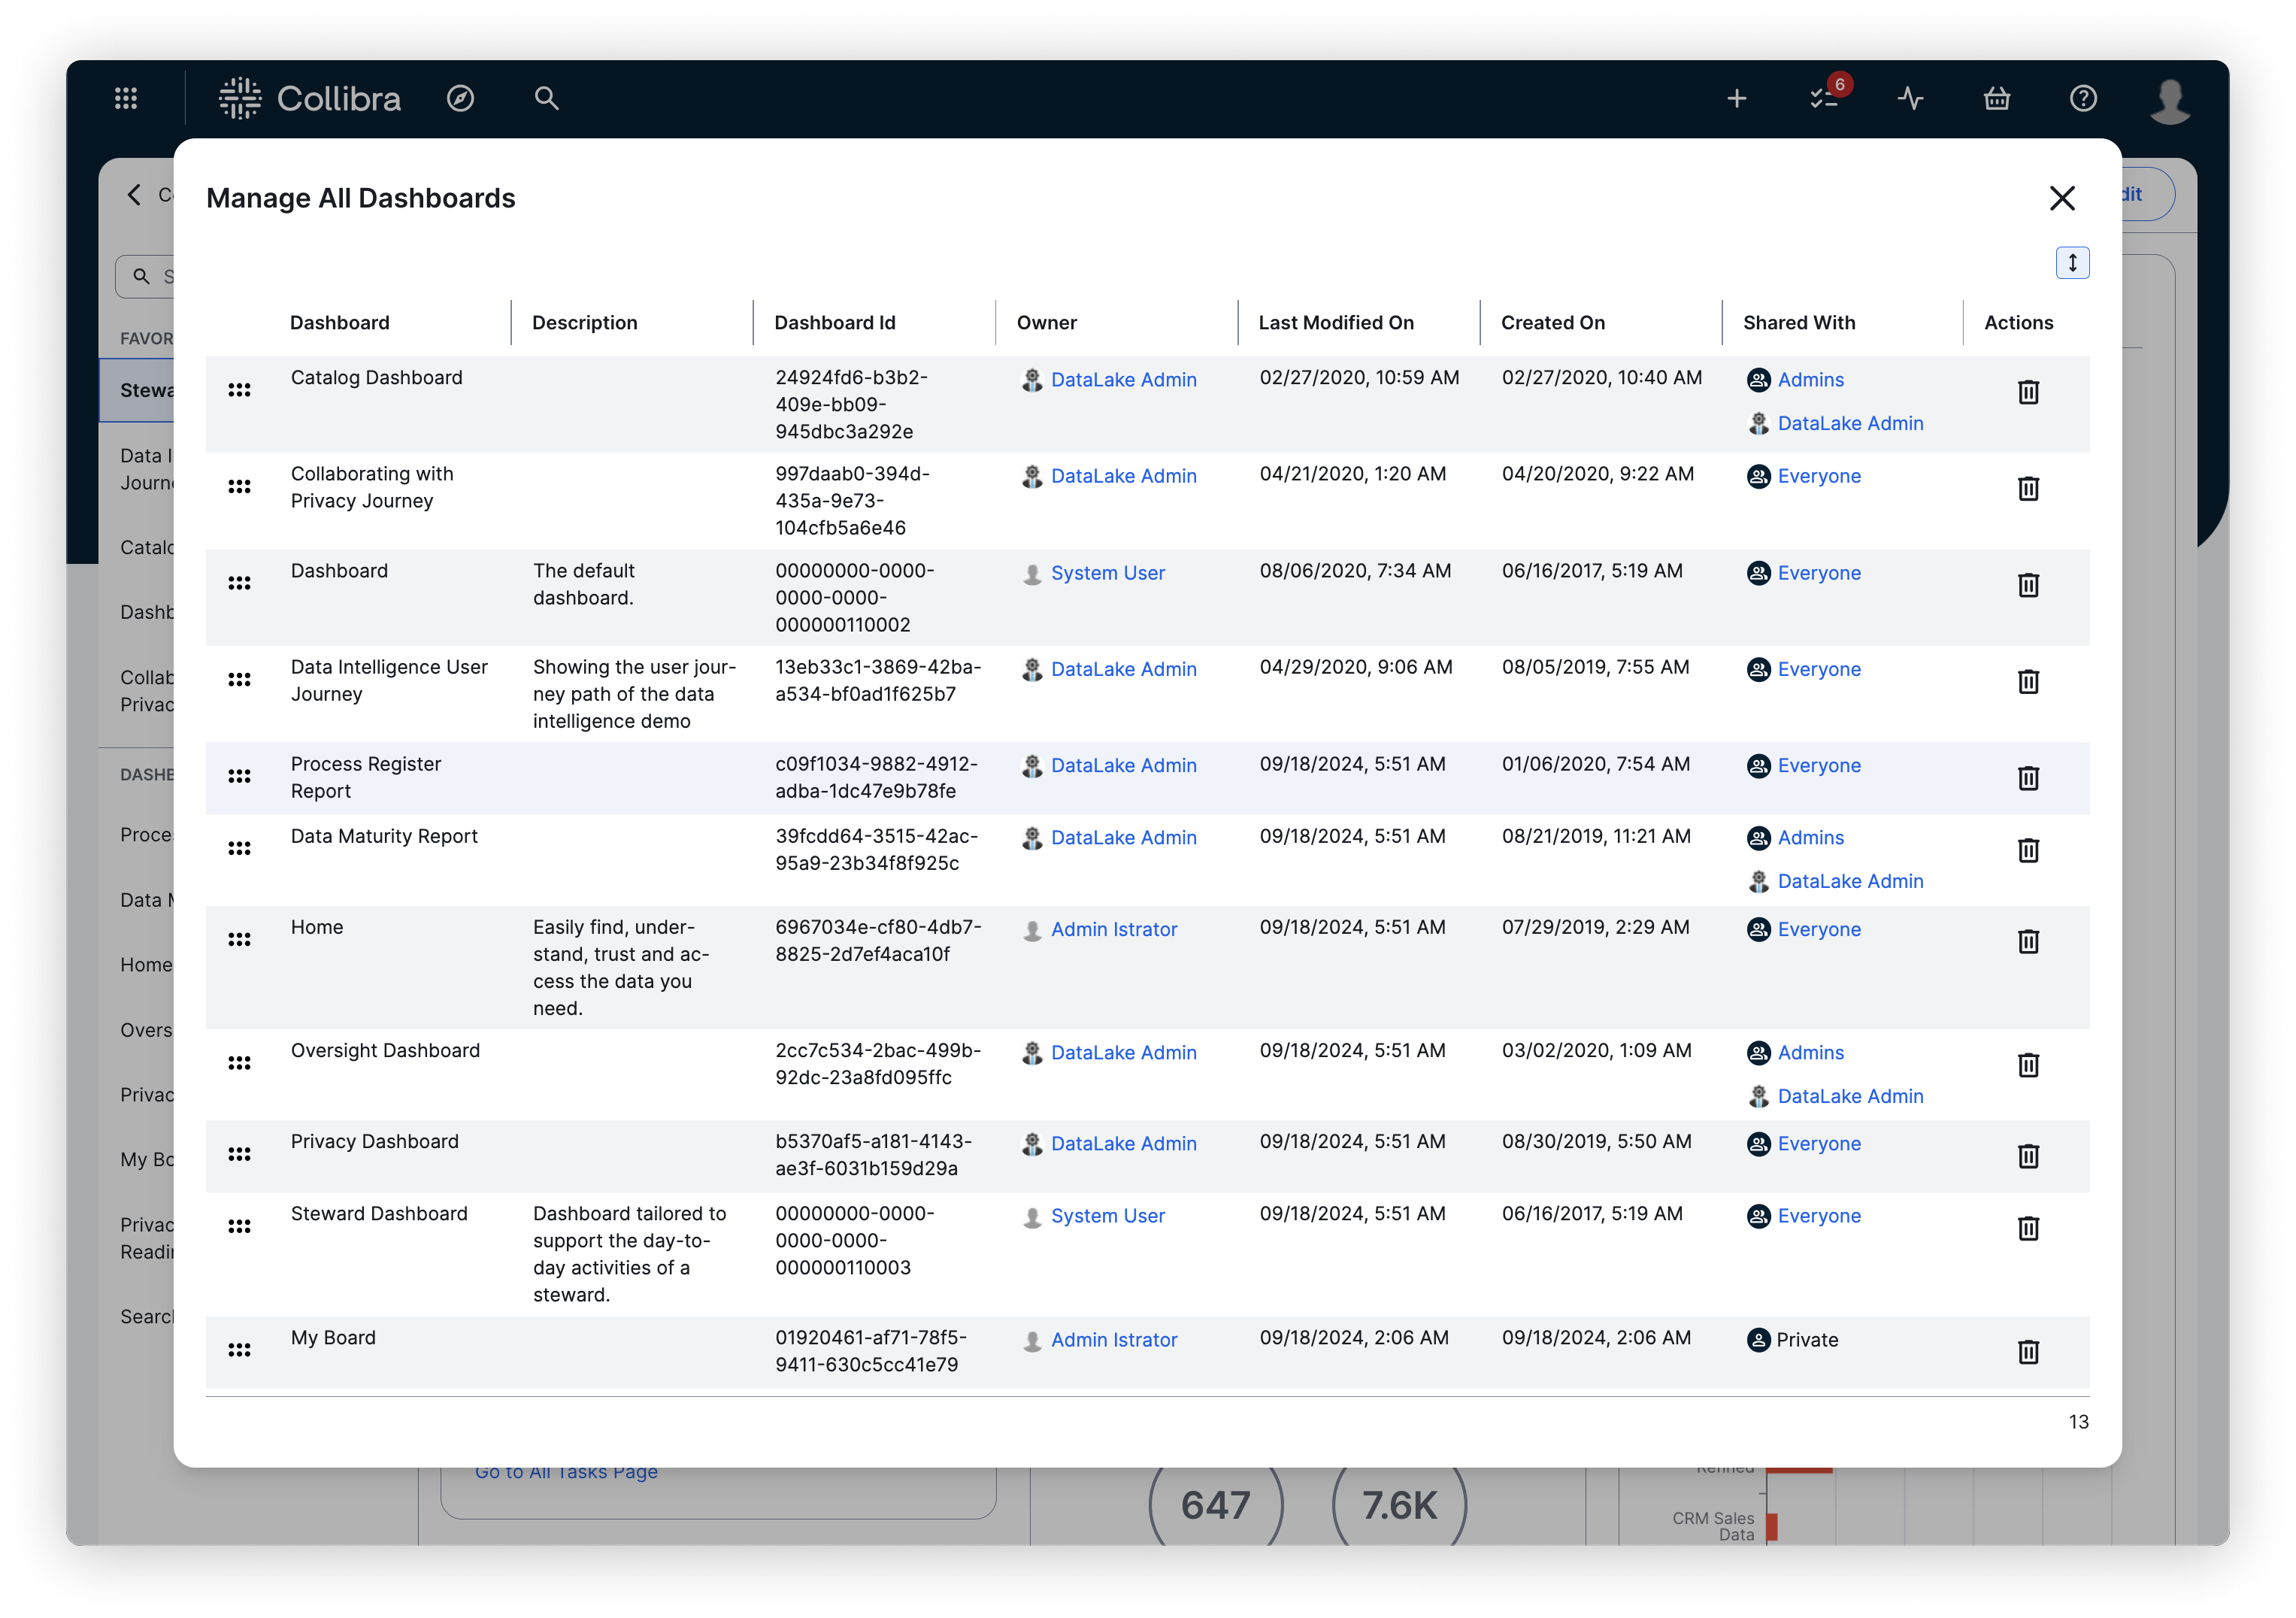
Solution 3: Allow Admins to Control the Ordering
Users were naming their Dashboards “1. Home” to force their preferred dashboards to the top of the list. With the new design, I introduced drag-and-drop functionality and favorites (stars) which allowed both admins and consumers to control their order of their dashboards in a single view.
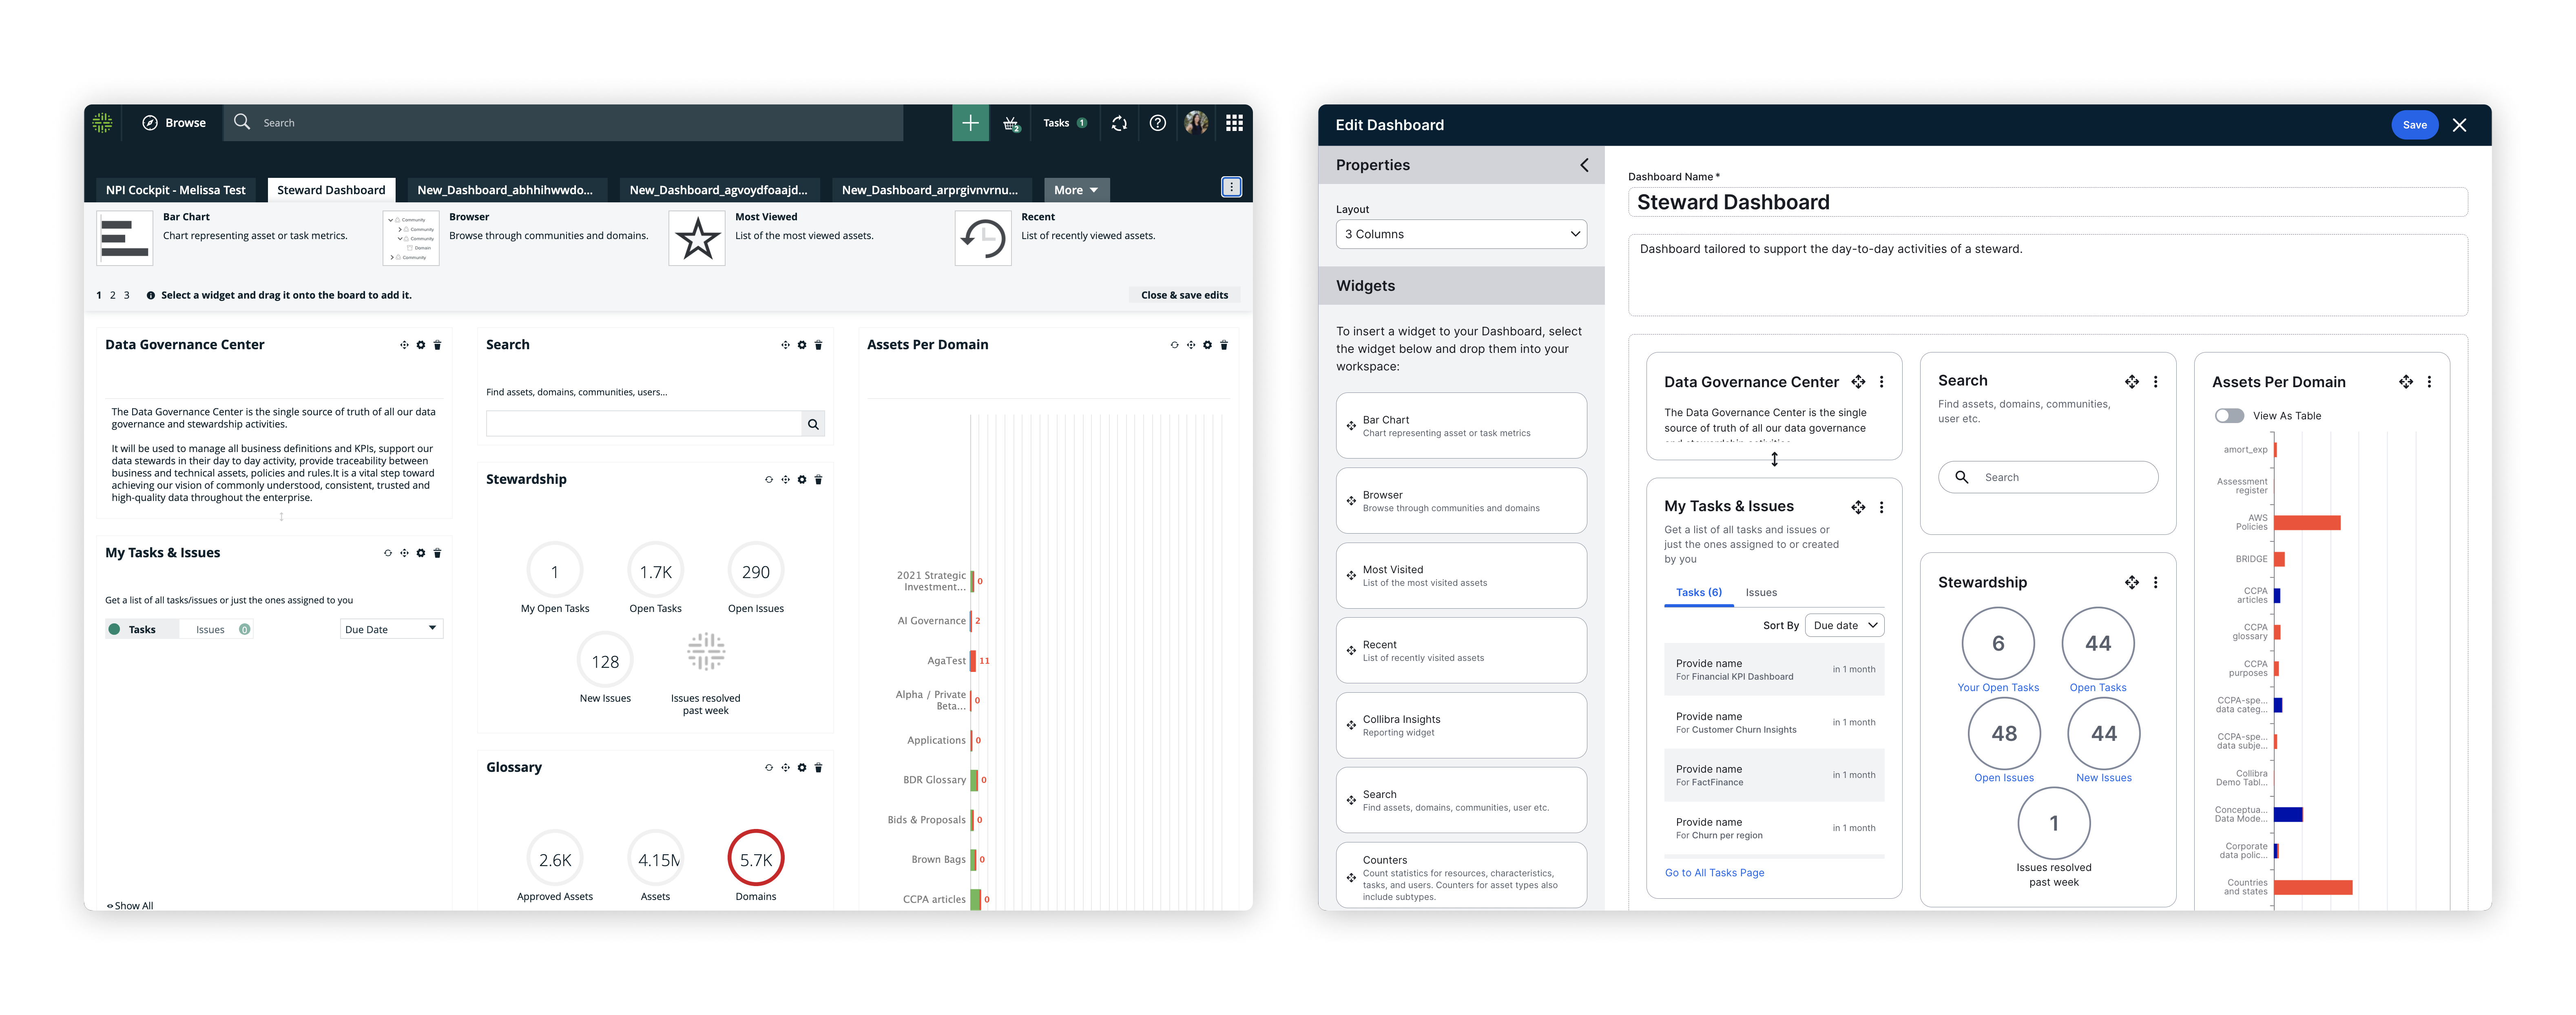
Solution 4: Improve Editor View
The old Dashboard editing experience looked almost identical to the published view and didn’t make full use of the page real estate. I designed the new Page Editor layout pattern to align with other page editor experiences in Collibra and give users more flexibility to customize their Dashboards.
Prototyping, UX Research, & Beta
Clickthrough
In June, I shared a clickable prototype during a 30-minute 1:1 UX Research study with seven Admin-level users. Despite the big changes, the UI was recognized as “easier to use” and user feedback was overwhelmingly positive. The new page layout was compared to familiar UI like Confluence and the new features like drag-and-drop, favorites, and managing dashboards were welcomed.
I set up a similar asynchronous survey for the Beta program In October where the new Dashboards UI will be available to many more users.
go back to home